Finshing Jim's Model and starting Pablo's

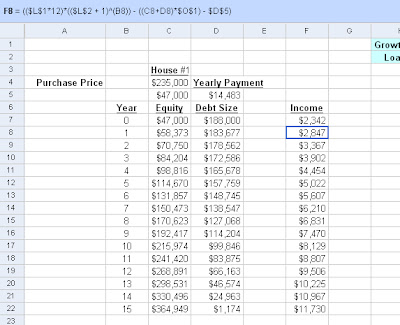
Last post we talked about figuring out how Jim's one house was going to grow in value over 20 years. We got up to year 15, where he only owed just over $1,000 on his house, which was now worth $365,000 and generated more than $2,000 a month in rental revenue.
Today let's talk about what's happening in year 16, when Jim starts saving for rental home #2, and let's see what happens from then until year 20, when our model will stop.
Going into year 16 we make a couple of manual modifications to our model. We have to modify the equity that we're taking to no longer account for our debt (because there no longer will be any), and we have to modify our income (which stands for annual income after expenses). Instead of subtracting the annual mortgage payments ($14,483) we only need to subtract $1,174, which is the amount left in our mortgage.
At the end of year 16 the house is now earning $25,950 a year after property taxes and insurance. In addition Jim now has $24,961 in his bank account. But since houses are now worth $377,000 in his area and we want to put 10% down, we're going to wait another year before buying.
In Year 17 the picture changes. We now have $50,000 in the bank, and with houses costing $388,00 Jim is going to go ahead and buy one. We then create a second set of columns for the second house and expand upon them.
The result is that at the end of 20 years Jim has a annual income (after property taxes, mortgage payments and insurance) of nearly $35,000. At the rate things are going, he will pay off the second house in less than 5 more years (year 25) at which point he'll have an annual income of more than $70,000 (after property taxes and insurance). If Jim is 30 years old, then he can look forward to having nearly a full salary each year just from his business, not even beginning to count the savings he hopefully has put aside for retirement through his day job.
Now this result needs some very important explanations. One critical assumption here is that there are no repairs needed on a property (which is practically impossible). The second is that he has no vacancies (much more plausible, but still difficult).
So our final result for Jim is that after 20 years:
Houses: 2
Annual mortgage liability: $26,000
Annual income after mortgages/taxes/insurance: $35,000
Equity: $590,000
Now on to Pablo. Without having done the math here, I'd like to make the hypothesis that Pablo is going to be worth a tremendous amount more, but also be on the hook for an amazingly large amount of money each year. Remember that while Jim was pouring his returns into paying down existing mortgages, Pablo is going to be saving his returns until he can purchase a new rental property.
The math is going to be the same, except that we are going to have to include a new column for Pablo that holds his savings. I'll leave the calculations out of the article, since it's essentially the same as Jim, just more numerous. After year 7, Pablo has saved up $33,752, while houses in his area are worth $297,691. Therefore he now more than a 10% down payment and can go shopping for another house.
So we begin the dance with two homes, and again Pablo will be saving up for his third home. Predictably, this home take far less time to save for, and Pablo can now purchase his third home in only 4 more years. So in year 12, his account sheet might look something like this, right before he buys a third house:
This will keep compounding, so let's just cut to the big finish.
In year 20, Pablo's company looks like this:
Houses: 6
Annual mortgage liability: $132,102
Annual income after mortgages/taxes/insurance: $42,254
Equity: $902,459
By running some simple numbers we can conclude that Jim enjoyed an annualized return of 13.5% on his investment and Pablo earned a very impressive 16% return. And that was assuming a rather conservative annualized appreciation of 3% a year. And this was only on the original $47,000. Neither Jim nor Pablo put any of their own money into their business after the initial infusion.
So we can come to the final answer that after 20 years, Pablo's more reckless style of investing has pushing his annual return up by 2.5% (which is a very significant number) but at the cost of quintupling his risk (507% the annual liability of Jim). Obviously, most investors want to play it somewhere in the middle. The more leveraged you are (meaning a larger number of mortgages) the faster your money grows, but that money will have to be paid back whether or not you manage to collect rent.
I just want to make a few small notes to conclude:
- Neither Jim nor Pablo put any of the money aside in case of emergencies and or vacancies. This was very foolish of both of them. One possible modification to the model could be saving 10% of their annual rental income for emergencies. Which is the inspiration for the picture at the top of the post.
- Both Jim and Pablo will end up multi-millionaires by the time they retire IF they continue to save from their employment income and invest it either in other house or stocks (or hopefully both). They'd be fools not to continue to save aggressively.
- While Pablo's model pushes hard for equity growth, it's easy to see how Jim's model is great for cashflow. One possibility is melding the two models. Start by expanding aggressively (but not beyond your means) and then eventually switch over to Jim's system and pay off your mortgages one at a time. That could provide some serious income.
- Bear in mind that even if you disregard risk, Pablo is also managing 3 times as many houses as Jim. That's a lot of work and a lot of time. Jim's method might have been less lucrative, but it's also much more manageable by a busy investor. Keeping two houses occupied and their tenant's happy is by no means a full-time job, but it's gets harder with each unit you add to the mix.


